1. Retrieve the Core Data: Attributed Sales and Spend
The Insights API provides two key metrics for calculating ROAS:
order_created_attributed_sales: Total value of sales attributed to your ads, in the account’s currency.spend: Amount spent on the campaign, ad group, or ad.
These metrics are available via four endpoints, depending on the desired aggregation level:
GET /v1/ad_account/insights: Overall account performance.GET /v1/campaigns/{campaign_id}/insights: Performance of a specific campaign.GET /v1/ad_groups/{ad_group_id}/insights: Performance of an ad group.GET /v1/ads/{ad_id}/insights: Performance of an individual ad.
Example Query for a Campaign
curl -G "https://api.ads.openai.com/v1/campaigns/cmpn_123/insights" \
  -H "Authorization: Bearer ${OPENAI_ADS_API_KEY}" \
  --data-urlencode 'time_granularity=daily' \
  --data-urlencode 'time_ranges[]={"type":"date_range","since":"2026-10-01","until":"2026-10-07","timezone":"Europe/Paris"}' \
  --data-urlencode 'fields[]=spend' \
  --data-urlencode 'fields[]=order_created_attributed_sales' \
  --data-urlencode 'fields[]=order_created_roas'
The response includes the requested metrics for each day in the period:
{
  "data": [
    {
      "date": "2026-10-01",
      "spend": 125.50,
      "order_created_attributed_sales": 502.00,
      "order_created_roas": 4.00
    },
    {
      "date": "2026-10-02",
      "spend": 89.20,
      "order_created_attributed_sales": 267.60,
      "order_created_roas": 3.00
    }
  ]
}Note: If order_created_roas returns null, it may indicate missing sales data or zero spend (F8). This is not proof of ineffectiveness but a signal to check conversion tracking setup.
2. Calculate ROAS and Segment by Visual
ROAS is automatically calculated by the API as the ratio order_created_attributed_sales / spend. A value of 4 means every dollar spent generates $4 in attributed sales (F2).
2.1 Isolating the Impact of Visual Ads
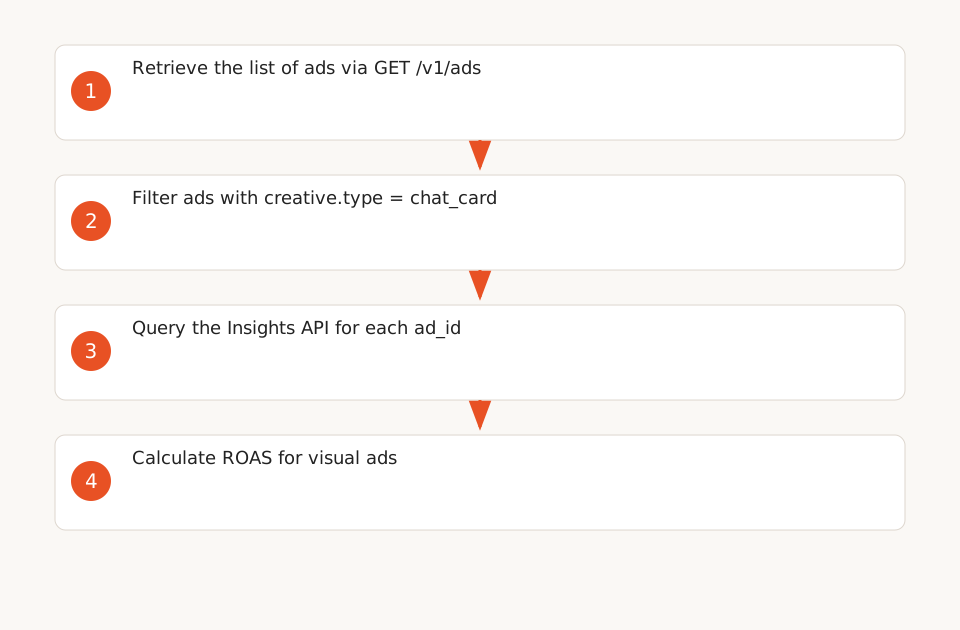
The API does not directly segment by creative type (e.g., chat_card), but you can:
- Retrieve the list of ads with their
creative.typeviaGET /v1/ads. - Filter ads of type
chat_card(F5). - Query the Insights API for each identified
ad_id.
2.2 Segmenting by Country and Device
To compare performance by country or device, add a segment to your query:
curl -G "https://api.ads.openai.com/v1/campaigns/cmpn_123/insights" \
  -H "Authorization: Bearer ${OPENAI_ADS_API_KEY}" \
  --data-urlencode 'aggregation_level=campaign' \
  --data-urlencode 'segments[]=country' \
  --data-urlencode 'fields[]=country.name' \
  --data-urlencode 'fields[]=country.spend' \
  --data-urlencode 'fields[]=country.order_created_attributed_sales'
This query returns spend and attributed sales for each country, helping identify the most performant markets (F3).
3. Refine Attribution with Conversion Windows
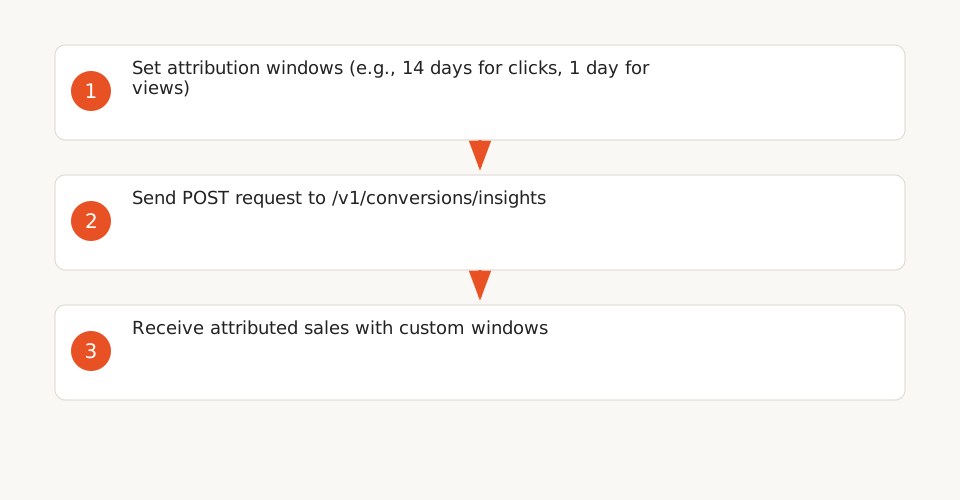
Attributed sales include click-through (clicks) and view-through (views) conversions, with default windows of 30 days for clicks and 1 day for views (F4). To adjust these windows:
- Use the
POST /v1/conversions/insightsendpoint with the following parameters: attribution_window_days: 7, 14, or 30 days for clicks.view_through_attribution_window_days: 0 (disabled) or 1 day for views.
Example Query with Custom Window
curl -X POST "https://api.ads.openai.com/v1/conversions/insights" \
  -H "Authorization: Bearer ${OPENAI_ADS_API_KEY}" \
  -H "Content-Type: application/json" \
  -d '{
    "entity_ids": ["cmpn_123"],
    "time_ranges": [{"type": "date_range", "since": "2026-10-01", "until": "2026-10-07"}],
    "attribution_window_days": 14,
    "view_through_attribution_window_days": 1,
    "include": ["order_created"]
  }'
This query returns conversions and attributed sales with a 14-day click window and 1-day view window, which may reveal different performance for longer purchase cycles (F4).
4. Automate Tracking with a Dashboard
To avoid pagination limits (2,000 rows max per query, F9), split reports by period or entity. Here’s an example of an automated workflow:
Key Steps
- Extract data daily: Use a Python script or a tool like Make.com to query the Insights API and store results in a database (e.g., PostgreSQL).
- Calculate derived metrics: Add columns for ROAS, CPA (cost per acquisition), or post-click conversion rate.
- Visualize trends: Use a tool like Metabase or Tableau to create graphs showing ROAS evolution by campaign or visual.
Example SQL Query for a Dashboard
SELECT
  date,
  campaign_id,
  SUM(spend) AS total_spend,
  SUM(order_created_attributed_sales) AS total_sales,
  SUM(order_created_attributed_sales) / NULLIF(SUM(spend), 0) AS roas,
  COUNT(DISTINCT ad_id) AS active_ads
FROM chatgpt_ads_insights
WHERE date BETWEEN '2026-10-01' AND '2026-10-07'
GROUP BY date, campaign_id
ORDER BY date;
This dashboard helps track the impact of adjustments (e.g., visual changes, attribution window modifications) on ROAS.
5. Limitations and Best Practices
- Missing data: Metrics like ROAS may be null if attributed sales or spend are missing (F8). Verify the setup of the conversion pixel or Conversions API to ensure complete tracking.
- Manual segmentation: The API does not automatically segment by creative type. To analyze visual ads, filter the
ad_idofchat_cardads (F5). - Attribution windows: Default windows (30 days for clicks, 1 day for views) may underestimate the impact of campaigns with long purchase cycles. Adjust them via the Conversions API (F4).
- Pagination: For accounts with high data volume, split reports by period or entity to avoid HTTP 413 errors (F9).
6. Next Steps
To apply these methods:
- Read our guide on calculating ROI for automation projects to extend these principles to other channels.
- Explore our insights on ad API integrations within a broader AI strategy.
- Test the Insights API with a test account to validate metrics before launching campaigns.